1
Derivatives Rollover Report | Sept 29, 202
3
For Private Circulat
ion O
nly
NIFTY & PCR Graph
Monthly Gainers
Scrip Price
Price
Change
(
%)
Open
Interest
Ol
Change
(%)
IDEA 11.75
28.42
1426080000
68.46
COALINDIA 293.00
26.68
77414400
21.49
PNB 80.10
26.54
250480000
(9.01)
MCX 2098.10
24.69
3262800
7.47
RECLTD 283.45
18.77
58752000
7.46
Note: Stocks which have more than 1000 contract in Futures OI.
Monthly Losers
Scrip Price
Price
Change
(%)
Open
Interest
Ol
Change
(%)
DELTACORP 142.20
(22.10)
10721200
(14.38)
BERGEPAINT 570.40
(19.76)
11667480
55.78
POWERGRID 200.50
(18.60)
74314800
80.39
VEDL 209.85
(10.13)
69678000
19.19
SIEMENS 3655.70
(7.56)
1777600
11.05
Note: Stocks which have more than 1000 contract in Futures OI.
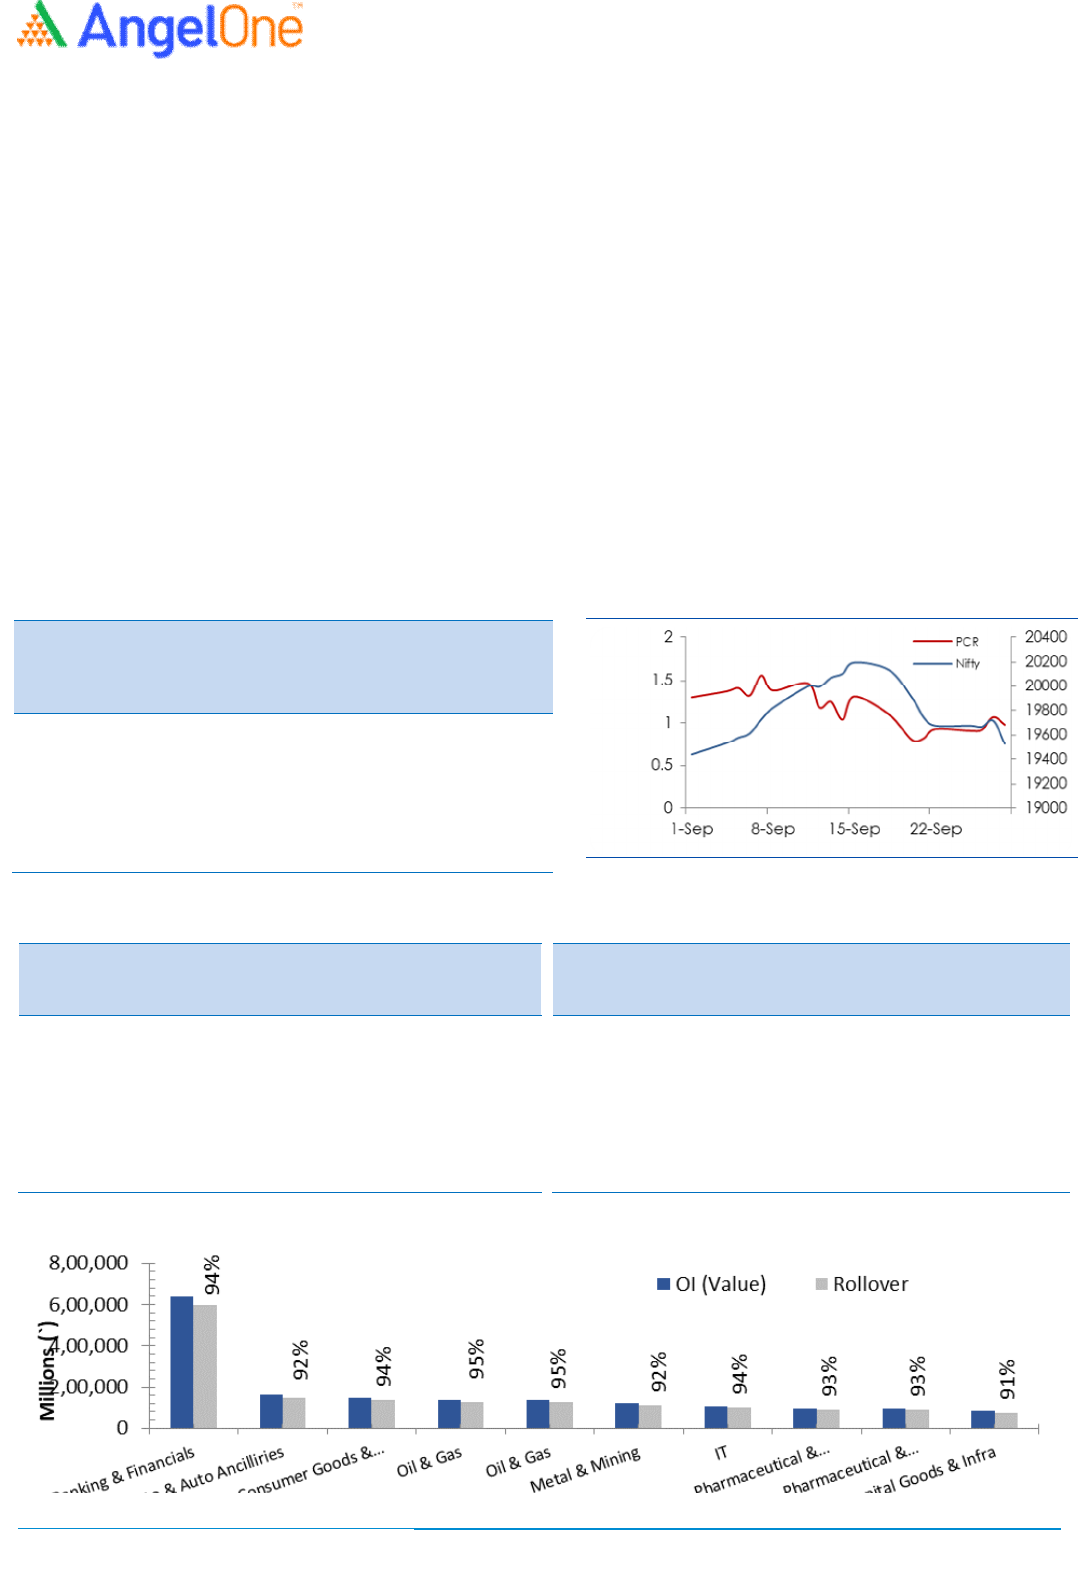
After a disappointing August series, the bulls took charge, particularly in the first half of the series, resulting in a spec
tacular rally
that pushed the market to achieve fresh record highs of 20
222.45. This rally unfolded smoothly, with any minor dips swiftly met with
strong buying interest. However, as the index reached elevated levels, caution set in, and this was soon followed by a signific
ant
bout of profit-t
aking, erasing a substantial portion of the earlier gains. Despite these fluctuations, the benchmark index concluded
the series with a gain of over one percent, closing slightly above 19500 mark.
In the previous series, we observed a mix of activities in
key indices, marked by an absence of significant changes in open interest
(MoM). Rollovers in the Nifty and BankNifty indices stood at 76% and 85%, respectively. While the rollover percentage for the
Nifty
is lower compared to the three-month averages, an
d higher for the banking index, when viewed in terms of percentages, it
suggests that we are commencing a new series with a low open interest base.
Continuing a trend from the previous month,
stronger players in the Indian equity market maintained their selling streak, they sold to the tune of Rs. 26,692 crores. Addition
ally,
they opted to reduce their bullish positions and added shorts in the index futures segment, causing their Long-
Short Ratio to
decline further from 51% to 28% series on series. For the upcoming series, the range of 19200 to 19400 stands as a strong
support
zone. As long as we respect this zone on a closing basis, the overall sentiment remains positive.
Indices Change
INDEX Price
Price
Change
(%) Rollover
3 month
avg.
NIFTY 19523.55
1.15
76.00 79.31
BANKNIFTY 44300.95
0.71
85.53 80.02
- - - - -
- - - - -
Derivatives Rollover Report
For Pr
iva
te
Circulation
Onl
y
2
Scrip Price
Price
Change
(%) OI Futures
OI
Change
(%) COC (%) PCR-OI
Rollover
(%)
Average
Rollover
(3month)
(%)
AUTO & AUTO ANCILLARIES
APOLLOTYRE 367.30
(5.82)
11237000
26.19 0.34
0.46
95.63
94.49
ASHOKLEY 175.15
(4.91)
76955000
(7.14) 7.59
0.58
93.14
89.94
BAJAJ-AUTO 5028.80
8.14
2301750
0.11 5.58
0.40
96.06
90.74
BALKRISIND 2519.25
7.52
1835700
2.86 -12.59
0.05
85.80
93.21
BHARATFORG 1091.05
1.21
9155000
(0.51) 8.59
0.49
96.65
94.97
BOSCHLTD 19112.65
2.22
116950
(2.54) -13.52
0.40
94.35
95.40
EICHERMOT 3465.15
3.14
3521525
(8.74) 9.05
0.45
93.91
95.21
ESCORTS 3234.45
1.82
1576850
27.11 10.99
0.51
82.71
84.48
EXIDEIND 259.35
(3.55)
15919200
4.02 6.34
0.67
93.51
95.17
HEROMOTOCO 2984.00
2.25
3801900
(2.49) 5.91
0.51
94.96
93.98
M&M 1565.05
(1.20)
15013600
3.23 7.28
0.52
95.07
94.81
MARUTI 10620.25
5.42
2920000
3.32 6.54
0.48
86.25
88.81
MOTHERSON 96.30
(0.16)
77091800
11.24 10.54
0.55
92.57
92.95
MRF 108788.70
(0.65)
42450
17.39 0.68
0.40
90.80
93.57
TATAMOTORS 618.15
2.10
66198375
7.09 8.30
0.64
91.94
91.44
TVSMOTOR 1524.55
6.71
7149800
(4.84) 0.54
0.48
93.21
93.44
BANKING & FINANCIALS
AUBANK 721.50
0.37
12351000
(16.07) 1.92
0.64
95.18
96.85
AXISBANK 1034.80
5.59
42510000
4.67 4.76
0.68
91.30
93.18
BAJAJFINSV 1547.25
3.24
9972000
0.24 6.21
0.53
95.72
92.33
BAJFINANCE 7797.90
8.19
4106250
(8.14) 9.59
0.67
95.61
95.98
BANDHANBNK 250.70
8.39
68422500
(13.74) 6.81
0.65
97.15
92.59
BANKBARODA 212.30
12.72
110682000
(8.48) 9.86
0.65
95.15
95.65
CANBK 377.70
17.23
47309400
(19.18) 10.59
0.79
92.83
94.37
CHOLAFIN 1229.70
8.90
13565000
(2.07) 10.22
0.50
95.98
96.92
CUB 126.45
1.81
39935000
1.76 10.54
0.68
96.38
95.72
FEDERALBNK 147.10
1.59
118360000
(10.05) 9.48
0.51
97.49
94.35
HDFC #N/A
#N/A
#N/A
#N/A #N/A
#N/A
#N/A
#N/A
HDFCAMC 2587.90
8.31
4738200
(9.59) 4.51
0.46
95.47
89.63
HDFCBANK 1533.15
(3.08)
151877000
14.48 7.81
0.59
98.00
96.54
IBULHSGFIN 186.15
(6.74)
54350700
(4.45) 8.51
0.65
86.80
89.97
ICICIBANK 947.95
(1.87)
91562100
1.51 7.14
0.52
96.61
97.61
ICICIPRULI 569.40
0.54
6708000
(17.11) 7.34
0.54
93.50
94.21
IDFCFIRSTB 93.65
5.58
261675000
(8.82) -11.98
0.50
95.66
95.38
Derivatives Rollover Report
For Pr
iva
te
Circulation
Onl
y
3
Scrip Price
Price
Change
(%) OI Futures
OI
Change
(%) COC (%) PCR-OI
Rollover
(%)
Average
Rollover
(3month)
(%)
INDUSINDBK 1423.70
2.83
23313000
13.18 9.53
0.84
97.70
96.33
KOTAKBANK 1741.95
(1.68)
32113200
8.10 6.35
0.79
94.09
87.35
L&TFH 127.35
1.35
67411896
6.60 6.96
0.79
87.31
90.68
LICHSGFIN 461.90
8.59
22100000
17.70 9.75
0.50
90.57
91.39
M&MFIN 292.10
(0.39)
37616000
0.44 0.86
0.65
95.38
96.04
MANAPPURAM 149.80
(3.73)
75456000
11.40 11.45
0.51
97.51
95.63
MFSL 910.80
(2.86)
7920800
24.74 6.32
1.46
98.33
85.08
MUTHOOTFIN 1218.05
(2.09)
6447650
2.15 3.47
0.56
95.81
93.33
PFC 246.75
(5.80)
63697250
0.70 9.51
0.65
89.59
89.14
PNB 80.10
26.54
250480000
(9.01) 7.11
0.70
94.09
95.47
RBLBANK 243.20
1.33
59600000
58.93 9.65
0.66
95.78
87.92
RECLTD 283.45
18.77
58752000
7.46 9.62
0.71
91.48
88.82
SBIN 592.80
4.86
86730000
(13.92) 6.08
0.60
90.74
92.65
CAPITAL GOODS & INFRASTRUCTURE
ADANIPORTS 829.75
4.02
51315200
25.93 10.17
0.74
97.62
96.90
BHEL 127.90
4.58
107215500
48.96 12.42
0.49
95.86
91.85
GMRINFRA 58.45
(5.95)
131220000
16.43 10.86
0.48
91.80
#N/A
HAVELLS 1384.75
(0.44)
5572000
2.03 8.79
0.53
96.70
96.20
LT 3027.10
11.52
8180100
42.27 7.13
0.66
82.47
85.02
SIEMENS 3655.70
(7.56)
1777600
11.05 10.10
0.70
95.64
92.10
VOLTAS 866.00
(0.73)
7330200
15.52 7.53
0.55
96.57
92.30
CEMENT
ACC 2011.75
(0.50)
5916900
(5.77) 9.71
0.56
96.21
94.40
AMBUJACEM 423.25
(1.95)
64524600
(4.34) 10.04
0.88
97.30
97.15
GRASIM 1922.35
6.66
12376125
(10.21) 10.46
0.50
98.38
98.05
RAMCOCEM 902.15
4.44
3349850
7.82 -9.55
0.37
96.29
96.42
SHREECEM 25833.35
8.02
177825
(1.25) 9.89
0.44
90.24
90.49
ULTRACEMCO 8188.60
(1.88)
1763000
37.61 5.29
0.39
96.24
95.15
CHEMICALS & FERTILIZERS
AARTIIND 487.80
(1.45)
14993000
38.64 5.57
0.70
96.89
96.16
COROMANDEL 1130.60
3.19
1135400
(22.73) 7.67
0.54
90.82
93.48
DEEPAKNTR 2106.70
(5.86)
2222100
(16.99) 3.75
0.52
88.16
89.27
NAVINFLUOR 4356.15
(5.45)
527550
(23.99) -0.45
1.07
93.49
93.31
PIDILITIND 2439.65
(3.75)
2199750
(12.36) 9.49
0.72
95.21
94.86
PIIND 3416.95
(6.51)
2727250
17.48 8.08
0.72
97.77
96.92
TATACHEM 1023.65
(4.18)
7217100
(8.55) 9.29
0.61
94.65
94.43
UPL
608.40
2.11
32862700
(6.78)
7.07
0.70
94.93
94.73
Derivatives Rollover Report
For Pr
iva
te
Circulation
Onl
y
4
Scrip Price
Price
Change
(%) OI Futures
OI
Change
(%) COC (%) PCR-OI
Rollover
(%)
Average
Rollover
(3month)
(%)
Consumer Goods & FMCG
ASIANPAINT 3177.00
(2.87)
6100000
46.85 2.64
0.44
93.70
94.28
BERGEPAINT 570.40
(19.76)
11667480
55.78 1.88
0.44
96.17
96.34
BRITANNIA 4541.45
1.06
1925600
(11.33) 4.72
0.41
96.42
93.14
COLPAL 1975.15
1.20
3380300
31.46 -2.58
0.14
79.87
89.67
DABUR 550.95
(1.13)
15981250
(9.51) 8.51
0.77
98.34
98.08
GODREJCP 998.25
(1.45)
8905000
7.20 9.78
0.53
97.72
97.67
HINDUNILVR 2465.15
(2.00)
10059600
19.56 2.46
0.56
89.82
93.52
ITC 442.50
0.27
69856000
4.05 5.00
0.62
90.89
92.40
JUBLFOOD 531.25
4.89
21138750
26.18 -21.88
0.56
91.09
90.54
MARICO 564.45
(0.75)
10219200
(0.21) 10.45
0.32
96.62
94.72
MCDOWELL-N 1007.50
(0.61)
9849000
1.89 6.85
0.65
96.32
97.00
NESTLEIND 22749.00
2.87
327800
2.35 11.78
1.11
95.30
92.47
TATACONSUM 880.25
4.86
10243800
6.81 5.38
0.53
93.81
93.76
METALS & MINING
COALINDIA 293.00
26.68
77414400
21.49 12.14
0.67
67.17
83.62
HINDALCO 470.30
1.61
22660400
(7.98) 9.30
0.51
92.94
88.33
JINDALSTEL 687.40
(0.12)
23123750
(9.64) 10.24
0.91
92.55
94.47
JSWSTEEL 773.10
(1.60)
18273600
0.34 8.19
0.89
89.83
94.54
NATIONALUM 93.55
(0.21)
61275000
25.10 5.40
0.57
91.24
85.85
NMDC 142.70
15.50
112734000
22.81 7.10
0.42
95.94
94.86
SAIL 92.35
1.65
131712000
9.87 7.54
0.53
95.60
94.30
TATASTEEL 127.55
3.20
209203500
(3.17) 7.44
0.52
95.00
94.04
VEDL 209.85
(10.13)
69678000
19.19 9.06
0.77
92.74
82.73
INFORMATION TECHNOLOGY
COFORGE 5147.00 (5.49)
1228500
4.56 5.79 0.64 85.93
86.63
HCLTECH 1241.30
5.18
8810900
(7.31) -0.66
0.47
74.46
88.00
INFY 1436.65
(0.59)
21149600
(16.91) -2.45
0.62
87.93
88.13
MPHASIS 2395.40
(1.97)
2453825
(1.33) 5.06
0.50
97.40
93.90
NAUKRI 4208.25
(3.44)
1328100
(13.12) 9.42
0.79
84.50
92.61
TCS 3547.70
4.95
9303875
(6.02) 3.90
0.77
86.02
91.00
TECHM 1232.35
1.79
12963000
3.76 2.92
0.57
93.85
90.28
WIPRO 408.35
(0.68)
43027500
24.45 9.32
0.63
95.32
95.38
Derivatives Rollover Report
For Pr
iva
te
Circulation
Onl
y
5
Scrip Price
Price
Change
(%) OI Futures
OI
Change
(%) COC (%) PCR-OI
Rollover
(%)
Average
Rollover
(3month)
(%)
INFORMATION TECHNOLOGY
HCLTECH 564.00
(0.70)
22885800
(1.26)
8.14
0.58
98.56
96.78
INFY 730.55
3.77
24351600
(52.50)
2.86
0.74
55.98
79.52
MINDTREE 782.95
10.93
1041600
(14.29)
-15.63
0.59
93.13
93.37
NIITTECH 1606.65
6.68
578250
26.08
-2.03
0.46
89.76
82.99
TCS 2212.80
6.19
15671500
(17.22)
6.42
1.91
95.02
94.74
TECHM 775.75
1.00
15406800
8.21
9.05
0.65
96.29
97.15
WIPRO 249.90
3.65
18211200
(29.64)
-2.08
0.72
83.12
92.60
MISCELLANIOUS
ABFRL 211.50
(4.17)
29881800
26.59 2.68
0.62
96.06
95.98
ADANIENT 2485.50
2.14
9361800
(15.86) 5.24
0.71
96.57
96.07
APOLLOHOSP 5062.90
4.36
2112625
(6.06) 10.71
0.49
92.98
92.43
ASTRAL 1899.80
(1.75)
3179688
(17.66) 0.86
0.61
94.75
92.78
BATAINDIA 1591.95
(5.53)
1339500
(8.64) 2.14
0.93
91.61
91.40
BEL 136.15
1.53
68519700
(8.15) 10.25
0.52
93.86
94.89
CONCOR 715.55
6.00
5657000
20.34 9.48
0.49
90.80
91.92
CUMMINSIND 1667.15
(2.23)
5224200
(18.85) -1.06
1.10
97.10
94.39
HDFCLIFE 637.50
(1.59)
16265700
(3.04) 5.55
0.71
96.28
93.42
ICICIGI 1283.35
(3.02)
3013500
(7.98) 8.99
1.20
96.73
97.29
INDHOTEL 407.20
(4.01)
18822000
(3.34) 6.37
0.55
95.47
95.69
INDIGO 2356.30
(3.89)
4795200
(29.44) 7.47
0.67
95.01
92.06
IRCTC 677.35
0.04
13415500
5.74 9.83
0.60
88.97
91.81
LALPATHLAB 2423.55
10.94
777000
25.91 7.79
0.50
91.52
90.68
LTTS 4579.80
3.26
625400
(0.19) -11.44
0.68
94.13
91.67
METROPOLIS 1414.30
4.83
1772800
9.65 9.37
0.87
97.66
95.27
SBILIFE 1295.40
(0.53)
7533750
(16.16) 5.86
0.57
92.01
92.83
TRENT 2072.90
0.39
3447200
(9.16) 5.09
0.40
94.21
93.38
MEDIA
PVRINOX 1715.30
(4.97)
5225066
26.88 5.49
0.57
91.14
#N/A
SUNTV 584.20
(6.09)
7923000
0.46 9.55
0.69
96.83
84.79
ZEEL 255.65
(3.11)
85635000
(1.43) 7.93
0.72
96.84
95.11
`
OIL & GAS
BPCL 345.15
0.74
27345600
(0.85)
4.39
0.53
95.02
94.46
GAIL 122.35
5.61
148596000
30.34
9.33
0.70
95.83
95.15
GUJGASLTD 418.20
(6.22)
11480000
37.14
9.86
0.98
93.44
88.79
HINDPETRO 251.15
0.60
52361100
12.01
7.31
0.56
97.17
94.75
IGL 452.25
(3.79)
12112375
22.96
6.86
1.33
97.25
96.04
IOC 90.40
0.84
114504000
9.11
8.41
0.40
95.85
94.80
MGL 1015.40
(0.37)
1852800
(24.83)
5.92
0.81
91.76
88.15
ONGC 189.05
7.81
46473350
35.61
10.74
0.24
50.18
59.73
PETRONET 236.90
9.27
19437000
(7.68)
8.29
0.41
87.42
88.83
RELIANCE 2348.30
(3.01)
52515000
22.94
7.66
0.71
96.06
92.57
BPCL 483.00
35.96
24672600
118.26
6.60
0.77
91.85
91.45
GAIL 137.85
6.65
41455848
1.71
5.87
0.75
92.61
92.09
BATAINDIA 1444.10
8.68
1488850
(10.54)
-2.88
0.42
93.06
94.61
BEL 115.85
1.49
22602000
(2.49)
10.21
0.44
97.34
96.42
M
CX
659.60
(6.88)
2102100
(7.23)
11.16
0.79
93.26
90.88
Derivatives Rollover Report
For Pr
iva
te
Circulation
Onl
y
6
Scrip Price
Price
Change
(%) OI Futures
OI
Change
(%) COC (%) PCR-OI
Rollover
(%)
Average
Rollover
(3month)
(%)
PHARMACEUTICAL
ALKEM 3539.55
(3.40)
787600
19.73 5.27
1.26
97.55
96.13
AUROPHARMA 880.10
5.46
13979900
0.09 9.36
0.47
97.32
95.47
BIOCON 268.00
2.80
27272500
(0.94) 5.19
0.56
95.62
95.90
CIPLA 1173.15
(6.67)
9536800
5.90 9.84
0.54
84.18
88.28
DIVISLAB 3690.90
2.10
2428400
(0.36) 8.91
0.36
97.13
94.66
DRREDDY 5468.50
(3.26)
2467500
(16.27) 9.15
0.37
92.41
94.62
GLENMARK 782.60
1.81
9032050
55.76 9.15
0.52
95.36
93.67
GRANULES 344.15
14.91
9994000
28.69 8.47
0.37
78.56
88.20
LUPIN 1139.35
3.25
5095750
(11.49) 7.00
0.78
90.07
90.21
PEL 1023.15
(3.56)
10357500
7.25 9.79
0.79
96.40
95.69
SUNPHARMA 1140.80
2.17
23419900
2.81 9.45
0.48
95.78
91.17
TORNTPHARM 1878.10
1.10
1996000
12.58 9.79
0.78
81.11
88.78
POWER
NTPC 239.10
8.12
89040000
46.29 10.88
0.45
84.99
75.89
POWERGRID 200.50
(18.60)
74314800
80.39 -1.57
0.43
90.40
92.42
TATAPOWER 260.10
5.32
89434125
(3.63) 10.00
0.56
96.16
95.68
REAL ESTATE
DLF 523.90
3.26
32963700
(13.56) 9.20
0.62
97.14
95.65
TELECOM
BHARTIARTL 931.50
8.14
36916050
(12.16) 7.95
0.83
87.61
93.52
IDEA 11.75
28.42
1426080000
68.46 10.80
0.49
92.99
85.55
INDUSTOWER 190.80
8.38
86258000
0.96 7.97
0.51
96.22
95.69
TEXTILES
SRF 2244.00
(5.39)
3701250
1.50 6.63
0.95
95.04
95.93

Derivatives Rollover Report
For Pr
iva
te
Circulation
Onl
y
7
Tech
nical an
d De
rivative
s Team
:
Sameet Chavan Head Research – Technical & Derivatives sameet.chavan@angelone.in
Sneha Seth Senior Analyst – Technical & Derivatives sneha.seth@angelone.in
Rajesh Bhosale Analyst – Technical rajesh.bhosle@angelone.in
Osho Krishan Senior Analyst – Technical & Derivatives osho.krishan@angelone.in
Hitesh Rathi Analyst – Technical & Derivatives hitesh.rathi@angelone.in
Research Team Tel: 022 - 39357600 Website: www.angelone.in
For Technical Queries E-mail: technicalresearch-cso@angelone.in
For Derivative Queries E-mail: derivatives.desk@angelone.in
DISCLAIMER
We, Angel One Limited (hereinafter referred to as “Angel”) a company duly incorporated under the provisions of the Companies Act, 1956 with
its registered office at 601, 6th Floor, Ackruti Star, Central Road, MIDC, Andheri East, Mumbai – 400093, CIN: (L67120MH1996PLC101709) and
duly registered as a member of National Stock Exchange of India Limited, Bombay Stock Exchange Limited, Metropolitan Stock Exchange
Limited, Multi Commodity Exchange of India Ltd and National Commodity & Derivatives Exchange Ltd. Angel One limited is a company engaged
in diversified financial services business including securities broking, DP services, distribution of Mutual Fund products. It is also registered as a
Depository Participant with CDSL and Portfolio Manager and Investment Adviser with SEBI. It also has registration with AMFI as a Mutual Fund
Distributor. Angel One Limited is a registered entity with SEBI for Research Analyst in terms of SEBI (Research Analyst) Regulations, 2014 vide
registration number INH000000164 and also registered with PFRDA as PoP ,Registration No.19092018. Angel Group does not have any joint
ventures or associates. Angel One Limited is the ultimate parent company of the Group. . Angel or its associates has not been debarred/
suspended by SEBI or any other regulatory authority for accessing /dealing in securities Market.
AOL was merged with Angel Global Capital Private Limited and subsequently name of Angel Global Capital Private Limited was changed to Angel
Broking Private Limited (AOL) pursuant to scheme of Amalgamation sanctioned by the Hon'ble High Court of Judicature at Bombay by Orders
passed in Company Petition No 710 of 2011 and the approval granted by the Registrar of Companies. Further, name of Angel Broking Private
Limited again got changed to Angel Broking Limited (AOL) pursuant to fresh certificate of incorporation issued by Registrar of Companies (ROC)
dated June 28, 2018. Further name of Angel Broking name changed to Angel One Ltd pursuant to fresh certificate of incorporation issued by
Registrar of Companies (ROC) dated 23-09-21.
In case of any grievances please write to: support@angelone.in, Compliance Officer Details: Name : Hiren Thakkar, Tel No. –08657864228, Email
id - compliance@angelone.in
Registration granted by SEBI and certification from NISM in no way guarantee performance of the intermediary or provide any assurance of
returns to investors.
This document is solely for the personal information of the recipient, and must not be singularly used as the basis of any investment decision.
Nothing in this document should be construed as investment or financial advice. Each recipient of this document should make such
investigations as they deem necessary to arrive at an independent evaluation of an investment in the securities of the companies referred to in
this document (including the merits and risks involved), and should consult their own advisors to determine the merits and risks of such an
investment.

Derivatives Rollover Report
For Pr
iva
te
Circulation
Onl
y
8
Angel or its associates or research analyst or his relative may have actual/beneficial ownership of 1% or more in the securities of the subject
company at the end of the month immediately preceding the date of publication of the research report. Neither Angel or its associates nor
Research Analysts or his relative has any material conflict of interest at the time of publication of research report.
Angel or its associates might have received any compensation from the companies mentioned in the report during the period preceding
twelve months from the date of this report for services in respect of managing or co-managing public offerings, corporate finance,
investment banking or merchant banking, brokerage services or other advisory service in a merger or specific transaction in the normal
course of business. Angel or its associates did not receive any compensation or other benefits from the companies mentioned in the report
or third party in connection with the research report. Neither research entity nor research analyst has been engaged in market making
activity for the subject company.
Reports based on technical and derivative analysis center on studying charts of a stock's price movement, outstanding positions and trading
volume, as opposed to focusing on a company's fundamentals and, as such, may not match with a report on a company's fundamentals.
Investors are advised to refer the Fundamental and Technical Research Reports available on our website to evaluate the contrary view, if
any.
The information in this document has been printed on the basis of publicly available information, internal data and other reliable sources
believed to be true, but we do not represent that it is accurate or complete and it should not be relied on as such, as this document is for
general guidance only. Angel One Limited or any of its affiliates/ group companies shall not be in any way responsible for any loss or
damage that may arise to any person from any inadvertent error in the information contained in this report. Angel One Limited does not
warrant the accuracy, adequacy or completeness of the service, information and materials and expressly disclaims liability for errors or
omissions in the service, information and materials. While Angel One Limited endeavours to update on a reasonable basis the information
discussed in this material, there may be regulatory, compliance, or other reasons that prevent us from doing so.
This document is being supplied to you solely for your information, and its contents, information or data may not be reproduced,
redistributed or passed on, directly or indirectly.
Neither Angel One Limited, nor its directors, employees or affiliates shall be liable for any loss or damage that may arise from or in
connection with the use of this information. Angel or its associates or Research Analyst or his relative might have financial interest in the
subject company. Research analyst has not served as an officer, director or employee of the subject company.
Investment in securities market are subject to market risks. Read all the related documents carefully before investing.
Any communication sent to clients on phone numbers or e-mail ids registered with the Trading Member is meant for client consumption
and such material should not be redistributed. Brokerage will not exceed SEBI prescribed limit. Any Information provided by us through any
medium based on our research or that of our affiliates or third parties or other external sources is subject to domestic and international
market conditions and we do not guarantee the availability or otherwise of any securities or other instruments and such Information is
merely an estimation of certain investments, and we have not and shall not be deemed to have assumed any responsibility for any such
Information. You should seek independent professional advice and/or tax advice regarding the suitability of any investment decision
whether based on any Information provided by us through the Site from inhouse research or third party reports or otherwise.
The report and information contained herein is strictly confidential and meant solely for the selected recipient and may not be altered in
any way, transmitted to, copied or distributed, in part or in whole, to any other person or to the media or reproduced in any form, without
prior written consent.
